
Indicators
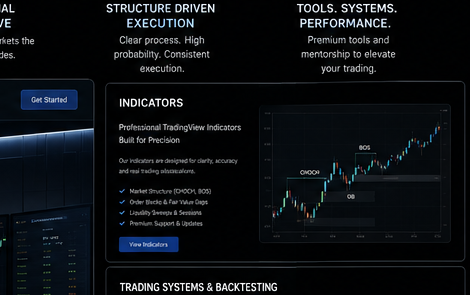
Professional TradingView Indicators Built for Precision
RVCTR indicators are designed to help traders organize market information, visualize structure and apply consistent rules. They are decision-support tools – not automated promises of profit.
Core Indicator Categories
Tools that organize analytical workflow.
Market Structure
BOS, CHOCH, swing structure, protected highs/lows and internal structure.
Liquidity
Buy-side/sell-side liquidity, sweeps, equal highs/lows and liquidity events.
POI Mapping
FVG, Order Blocks, displacement zones and configurable areas of interest.
Execution Tools
CISD/confirmation logic, session filters, alerts and structured checklists.
Risk & Utility
Risk/reward overlays, position-sizing helpers, session timing and dashboards.
Custom Indicator Development
Translate clear, testable logic into TradingView tools.
Have a defined trading concept or workflow that is difficult to execute manually? RVCTR can translate clear, testable logic into a custom TradingView indicator or utility. Custom development starts with a written specification and feasibility review. RVCTR does not convert discretionary financial advice into automated recommendations for individual users.
- SpecificationDocument logic, inputs, conditions and alerts.
- FeasibilityReview technical limits and compliance boundaries.
- BuildDevelop the indicator, dashboard or utility.
- ReviewTest behavior against agreed acceptance criteria.
Custom indicator request